

Report Postclose
Remove Postclose
Are you sure? After you remove the post, it will no longer appear in channel listings but you can access it directly. You can undo this later by clicking "approve".
Delete Postclose
Are you sure you want to delete this post? This is a permanent action and cannot be reversed.

Ever since I saw Dr. Crusher in Star Trek: The Next Generation magically diagnosing patients by scanning their bodies through a tablet known as the ‘tricorder’, I became obsessed with creating an all-purpose machine like it. It wasn’t just the novelty of the machine, which could be recalibrated to do a variety of tasks (and hence would be vital in space exploration ventures), but also the practical utility of an integrated directory which logs and classifies all instances of machine application. Data is sparse in healthcare and data collection is limited by ethical and technical barriers. I won’t delve into the technicalities of how our detectors work, as they have already been documented in the Products module. I will, however, provide a high-level overview of our promise for revolutionizing healthcare.
We won’t steal your data and profiteer off it. We will provide our customers the option to opt for either a fully paid subscription or receive 50% off by sharing their data with us. This data will include the location of the application instance, details about device models used, the range of tests used, overall disease diagnosis and prognosis etc. This data will be fed to our neural engine, which will classify it and match it with labs who are working on developing cures to the problem in question. They may choose to either partner with us or pay royalties for data. We are aware that most contraindications of commonly used drugs against pregnant individuals, ethnic minorities and people with rare disorders remain understudied. Application of our app on a global scale will provide a large enough data set to customize these products for most exceptional cases.
The impact of COVID-19 was exacerbated due to a lack of dynamic workflows for handling big data pertaining to healthcare and its utilization as well as the mobilization of resources. It also took a considerable amount of time to learn about proper contraindications of the COVID-19 vaccines, which not only eclipsed public faith in vaccines, but also made it harder to curb the pandemic. We can bypass the public distrust and system-wide inefficiency in handling big data by mandating the daily administration of a mobile test in the event of such a crisis. This will give us valuable data about different viral hotspots, red zones and the travel of different variants cross-region and help us optimize the enforcement of lockdown and preventive protocols more efficiently, reducing the economic damage in the short term, and hopefully its cessation in the long term.
Most chronic illnesses and their resulting fatalities are caused by lack of a timely diagnosis. This pressurizes the exchequer and creates disappointment and misery that could have been mitigated had there been a diagnosis on time. In resource-scarce counties, it creates widespread disorder and financial strain, both on a public and private level, as the cost of keeping the patient alive increases exponentially with respect to disease prognosis. This is especially true for cancer patients, for whom every month lost in diagnosis means 10% lesser chances of survival. This comes with a bill in excess of 100$ billion. According to Precedence Research, the global clinical trials market size is projected to be worth around US$ 84.43 billion by 2030 from US$ 48.4 billion in 2020, growing at a CAGR of 5.7% from 2021 to 2030. Most of the industry is centered around large-scale trials which would be overridden by our integrated data bank. There is also a lack of centralization and logistical backlog. Adoption of my test, which is not only more specific than SPECT but also allows for multiple simultaneous screenings, would disrupt the cancer diagnosis and research market. In England alone, 3620 avoidable cancer deaths have been predicted for four major cancers representing about 40% of total burden. These deaths are expected to translate into economic losses of £103.8 million. This diagnosis pandemic arises not only because PET and SPECT are expensive and complicated tests that bankrupt patients, but also because doctors only recommend them at the last stages of treatment. Tricorder 1.0 is the stepping-stone in the direction of an inexpensive one-window diagnosis at your convenience and will have revolutionary impacts on the landscape of freely accessible healthcare on a global level.
We are currently aiming to deliver our first multipurpose prototype in September 2022. We will set the subscription fee to be a meagre, 5 dollars per month. This will be a big relief for all the people who are robbed off their lifesavings by medical moguls. Due to the disruptive nature of the project, we project that it will grow to a volume of a billion users in December 2022. This amounts to 60 billion dollars in pure profit per year for the govt. of Pakistan provided it funds it. The number of users will continue to grow, as we expand the project, and it will become synonymous with healthy living in a modern society at an affordable rate for all in no time. Our promise is not of an economic nature to our customers. But a shift in lifestyle. Instead of death being a looming sword hanging over our heads, due to undiagnosed diseases, we aim to bring about a diagnostic revolution and create a sustainable lifestyle, better medication and sounder world health economy and at the same time help our country overcome its cashflow problems.
Tricorder 1.0
Tricorder 1.0 is our state-of-the-art cross-platform application which can detect both COVID-19 and Influenza infections in 15 minutes via your mobile phone and a 7$ kit, with the accuracy of an RT-PCR test. Moreover, our cutting-edge neural engine can provide insights on disease prognosis, the spread of infection into the body and can also give rudimentary medical advice to minimize the damage before hospitalization. We use a mix of LIF-LIDAR, LAMP and CLI to generate the results. Our findings are well-documented by experimental evidence and have been featured in reputed peer-reviewed journals and conferences. Below is a general schematic of how the application works:
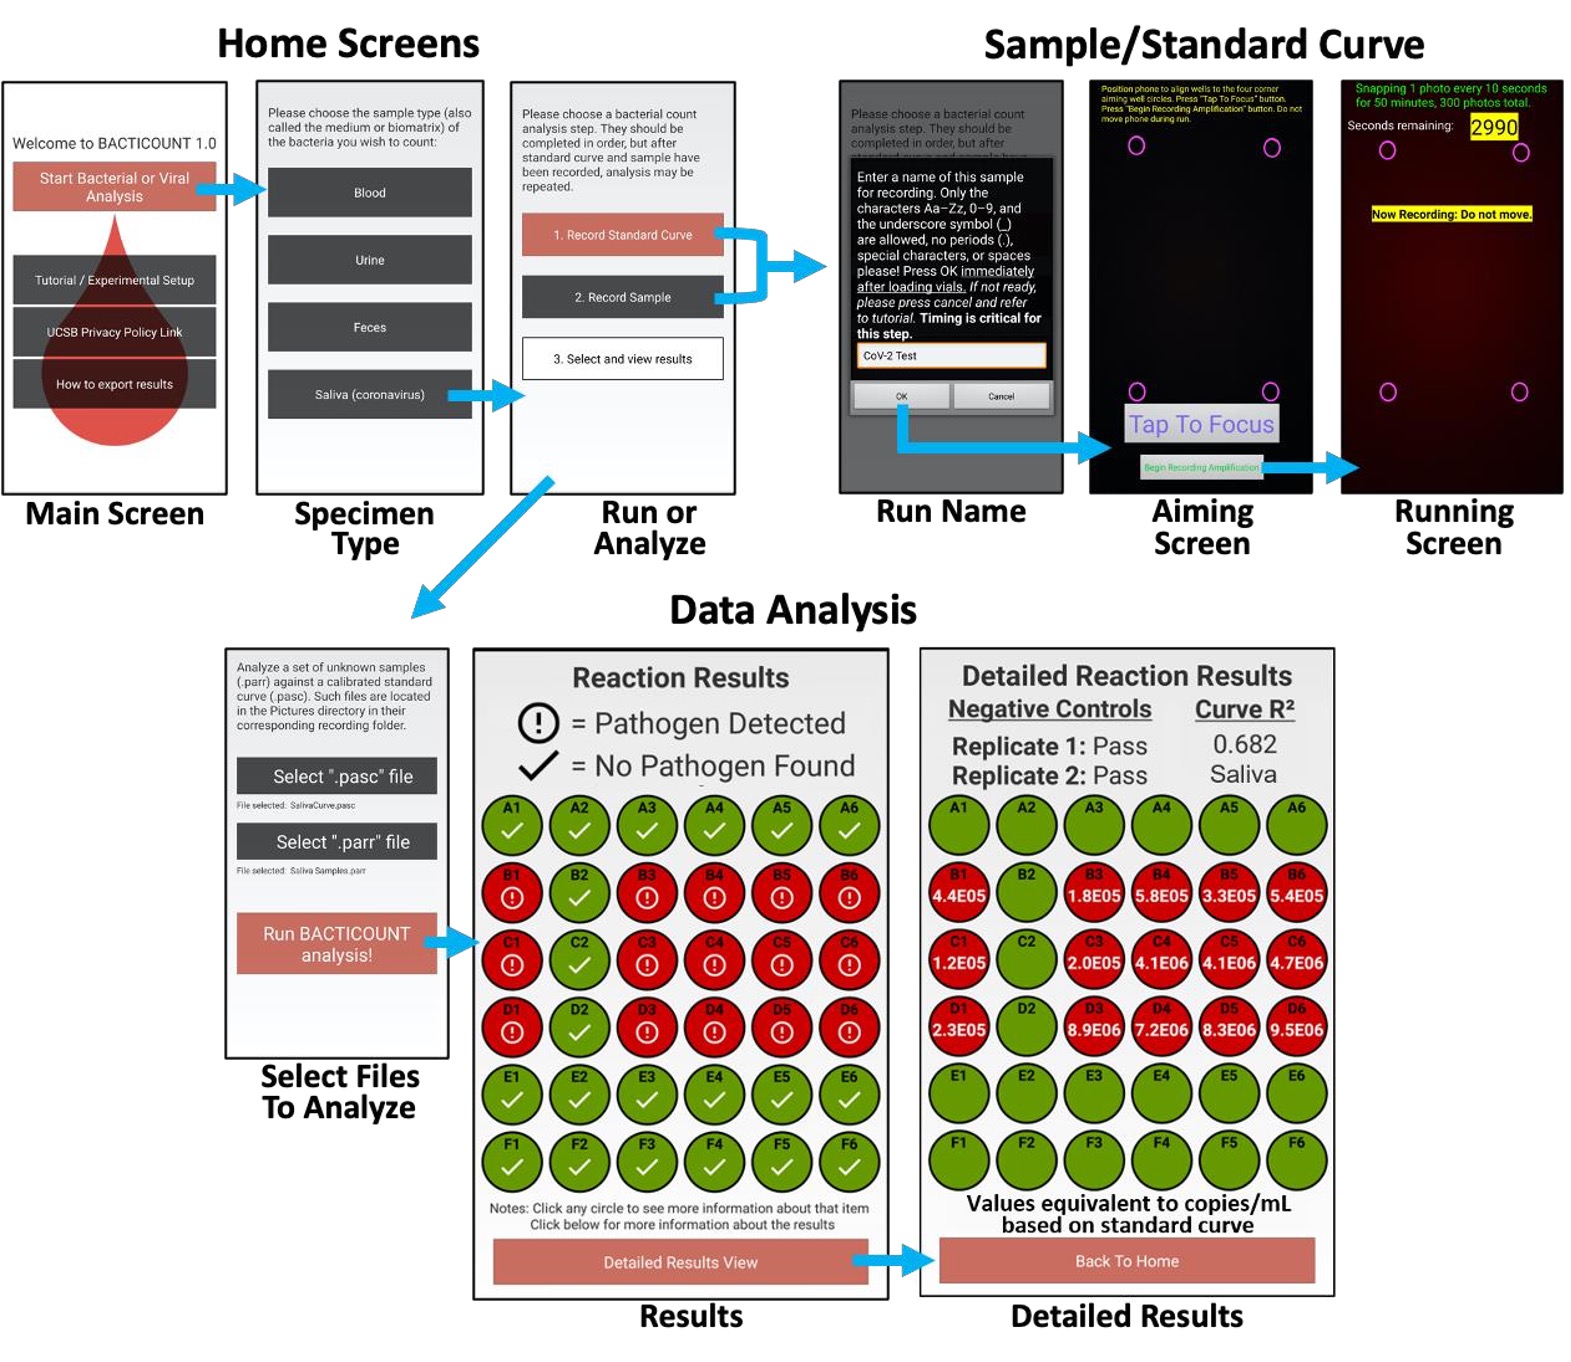
The device consists of three main components: heating module, assay reaction housing module, and an optical detection module, which houses a Cherenkov Detector and LIF-LIDAR component. Using the CoV-specific primers and without any sample preparation, the virus detection rate at 103 PFU/mL was found to be 100% specific. The smartphone-anchored system can be used for qualitative detection, thereby also making it easier for non-experts to use. The outputs are easily analysed using smartphone application which also enables sharing the results with experts in a different location promoting cross-validation. The module is also capable of flow cytometry and showed a dramatically higher specificity and sensitivity when compared to commercial hemocytometer.
Virological analysis is the set of techniques used to determine the presence of specific viruses in different types of samples, from human to environmental monitoring. In this latest case, the virus analysis consists of two phases: the concentration step and the analysis of the sample. Once the volume to be analysed has been reduced, the test phase can be carried out by virus isolation on a susceptible cell line or through innovative molecular methods based on PCR, including qRT-PCR1, RT-PCR combined with the hybridization to specific probes2, nanofluidic real-time RT-PCR, digital PCR, etc. All these approaches show several limitations related to the nature of the viruses and the environment where they have been collected. At first, a unique cell line for the isolation does not exist, but it depends on the virus behaviour. Furthermore, some viruses do not multiply on cell lines. The molecular methods require a small volume of sample, and the presence of other compounds may interfere with the reaction. Thus, specific primers are used, and the resulting amplified region must be sequenced and analysed by means of databases.
Because these methods are time-consuming, the environmental monitoring of viruses is usually not performed. For instance, the isolation of wild-type hepatitis A virus on specific cell lines (if the particular strain can be cultured, for instance, wt HM-175 strain) may take 3–5 weeks and at least two passages on cells, whereas the molecular methods require 3–5 days10. For this reason, drinking water analyses provide biological (bacteria) and chemical details, while virological analysis is avoided until an outbreak spreads. Furthermore, due to the long time needed, the virological analysis does not comply with proper water monitoring.
The possibility of performing analyses in just a few minutes or even continuously is certainly an advantage if compared to the 3–5 days needed by molecular methods or the few weeks for virus isolation on cell lines. For example, consider how fast detection may be relevant in cases of virus diffusion, as it would enable countermeasures to be taken immediately.
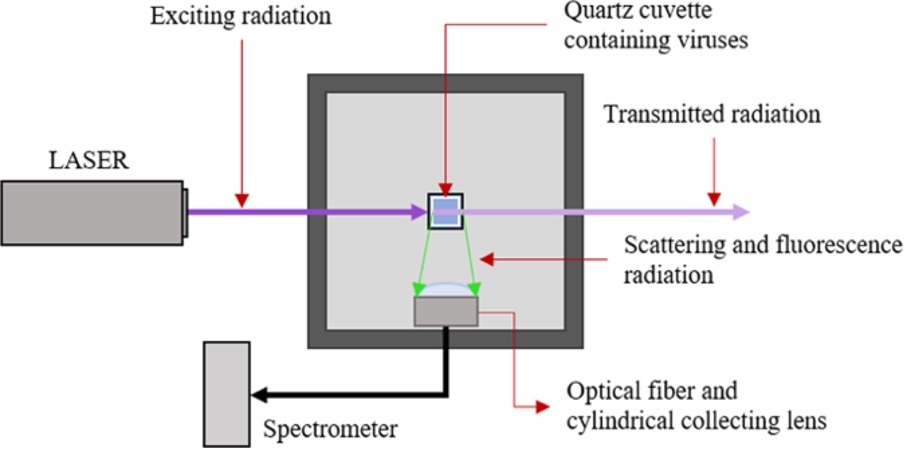
The aim of this work is to demonstrate the applicability of laser-induced fluorescence (LIF) for virological analyses of environmental samples. By irradiating the sample with UV light, some molecules absorb and re-emit less energetic radiation (visible region). This phenomenon is called fluorescence, and the spectrum emitted is a function of the specific molecules compounding the microorganisms. Although this technique has already been used for bacterial classification no evidence of its applicability to viruses has been reported in the literature.
LIF could be a proper approach to developing an instrument suitable for analysing and classifying viruses. Due to their molecular composition, different viruses emit dissimilar spectra as a fingerprint, allowing their classification. Moreover, the evaluation of the sample concentration could be performed due to the correlation of this parameter with the fluorescence intensity.
In this work, the measurement of laser-induced fluorescence on viruses has been investigated, and the results show the interesting potential of this technique. Basically, it has been demonstrated that the classification of viruses could be performed by means of this technique. The LIF approach is based on exciting the fluorophores contained in the envelope proteins of the viruses by proper radiation (in our case, the wavelength was 266 nm). Since differences between the chemical compositions of viruses are expected, different fluorescence spectra are expected as well. Thus, the fluorescence spectrum is characteristic of the viruses shown, similar to a fingerprint. By developing a database where the spectrum of each virus is recorded, it could be feasible to classify the virus analysed accordingly. The classification is allowed by a proper classification algorithm, such as the three shown in this work (decision tree, support vector machine and neural network). In our simplified case, where the number of classes is six, this algorithm allowed us to reach a very high accuracy (95%, 100% and 100%). In a real case, where the number of possibilities may be much greater, these algorithms and this approach should be integrated with more sophisticated machine learning methods. Furthermore, much interference may occur due to the presence of other agents (e.g., chemicals, bacteria, or fungi). The environmental viruses available in the aqueous and food samples belong to 7–8 species. As all of them show the same behaviour, it is not unlikely that two or more viruses can be present at the same time. Isolating and classifying two or more viruses from the same sample is not simple neither with cellular lines nor with molecular methods. In this case, the pool of four viruses was well distinguished from the single viruses. To date, it is practically impossible to discriminate the different viruses in the pool. However, the classification of different strains is theoretically possible. For the bacterial classification, data scientists are working to find the best algorithm to classify different agents in a pool. However, this evaluation requires optimization of the spectra, which may be achieved by increasing the power of the laser, the time of lamp exposure and the number of measurements. Thus, the technology used to carry out the tests is still not optimized and needs to be improved to be applicable in real contexts. First, the classification of a larger number of viruses may be solved by increasing the number of wavelengths that irradiate the sample. Basically, the fluorescence spectrum changes with the irradiation wavelength, as the fluorescence cross-section changes with the wavelength, and some fluorophores become dominant only at specific wavelengths. Thus, it could be viable to obtain more “fingerprints” for each virus, involving a larger amount of information and a more accurate classification. For the interference, different solutions should be investigated. First, the spectra of interference commonly found in the specific application may be recorded. Thus, the classifier algorithm may also be trained with the fluorescence spectra of the background material. However, its huge variability may increase the uncertainties of the classification. Alternatively, a middle step, such as a differential centrifugation of the sample, may help to exclude some of these uncertainties. Finally, the classification of a virus in a mixture of viruses should be theoretically achievable, as the fluorescence spectrum of the sample should be the sum of the fluorescence emitted by each virus.
The sensitivity analysis, carried out by diluting Hepatitis A, has shown that the system is able to perform a measurement with a small concentration of viruses. In our case, the lower limit is between 10^4 and 10^5 TCID50/mL. Furthermore, the system should be improved, allowing a measurement of smaller concentrations. For example, the spectrometer used has a maximum exposure time of 1 minute. If the exposure time is increased to 10 minutes, the minimum readable concentration may be 10 times lower if no linear effects are observed (no linear effects may arise only in the case of large concentrations, which is not the case here). The fluorescence light may also be increased by intensifying the laser radiation. The collecting system efficiency may also be improved to increase the amount of fluorescence light analysed.
It is good to remember that the molecular tests at the beginning had low sensitivity. The sensitivity was increased by using the new generation kits, purifying the samples, improving the primer sets, etc.
In conclusion, it is believed that the LIF method may be the basis for the development of a new tool to analyse and monitor viruses. The main advantage of this technique concerns the time of the analysis, considering that this measurement should require an analysis time no longer than a few hours (for very small virus concentration). Furthermore, this tool may involve a significant reduction in the costs of virus analysis, as the fixed costs should be high but the variable costs (i.e., electricity and manpower) should be near zero.
This method may find applications in many fields, e.g., the continuous monitoring of the environment, such as the drinking water. It may be possible to develop a stand-off instrument able to detect and classify the presence of specific harmful viruses and to give a proper alarm. It may also be linked with a disinfection system that intervenes only when needed, avoiding unnecessary operations and reducing energy consumption and costs. For the bacterial classification in the literature, the technology may be used as a point sensor or a remote range apparatus. The same approach may be used to develop a laboratory instrument that is able to guarantee accurate virus classification in a shorter time.
This technique could also be applied to the analysis of biological agents in different matrices, such as in food, the perishability of which is a key factor for marketing. For instance, the consumption of raw or undercooked bivalve molluscan shellfish is the principal vehicle of Hepatitis A virus (e.g., in 2018, these shellfish were associated with 43.9% of Hepatitis A cases in Italy, where the incidence rate was 1.5 cases per 100.000 inhabitants27).
Moreover, this approach may find interest in clinical applications. Even in these cases, the virus isolation is quite long, providing an important response after days or weeks. Thus, when the time is shortened, important advantages may be obtained. However, a clinical application must be deeply investigated, as the presence of background material (e.g., proteins in blood) may be dominant, making the virus fluorescence signal fully covered by the background fluorescence. Thus, a pre-analytical phase may be needed. Regarding sensitivity, it can be tuned as mentioned in the discussion section (exposure time, radiation energy and collecting system improvements).
Can we able to make fast recovery from similar pandemic.